Laclave Improvement shows steady progress in overall website performance, with consistent user engagement and growing visibility across key traffic channels. Recent optimizations have contributed to improved content reach, stable session activity, and sustained user interaction. While minor fluctuations are present, the overall trend indicates positive momentum and clear opportunities for further growth through continued SEO refinement and content optimization.
Category
Full-Service Branding, Development & SEO Growth Strategy
Start Date
19 April 2023
Client
Laclave Improvement
Handover
25 December 2023
Regular Medium SemiBold Bold
This Is Text Message Medium Typography Just Amazing Awesome
Before
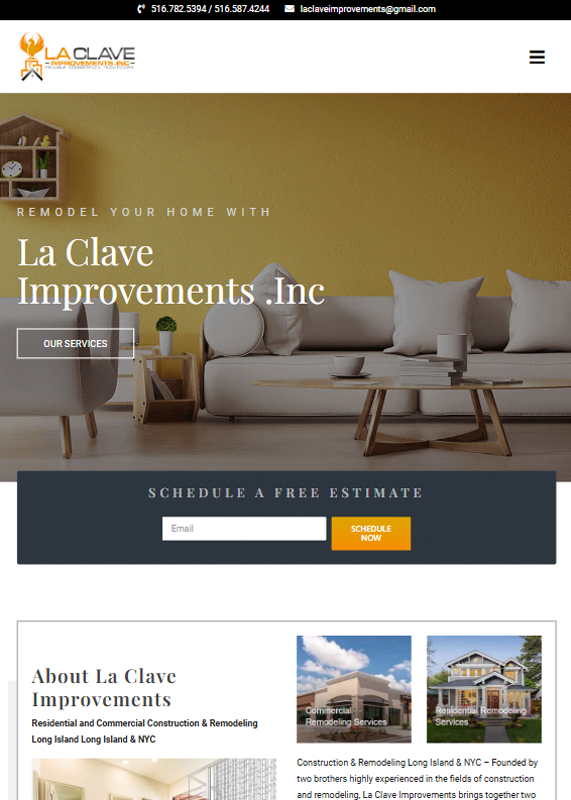
Desktop Design Weaknesses
The desktop layout of the website feels dated and overcrowded, with misaligned spacing and mixed font styles that impact its overall polish. The color selection lacks harmony, and the yellow hero section does not align well with the brand’s visual identity. Key elements such as navigation and call-to-action buttons lack emphasis, which affects usability and reduces user engagement.
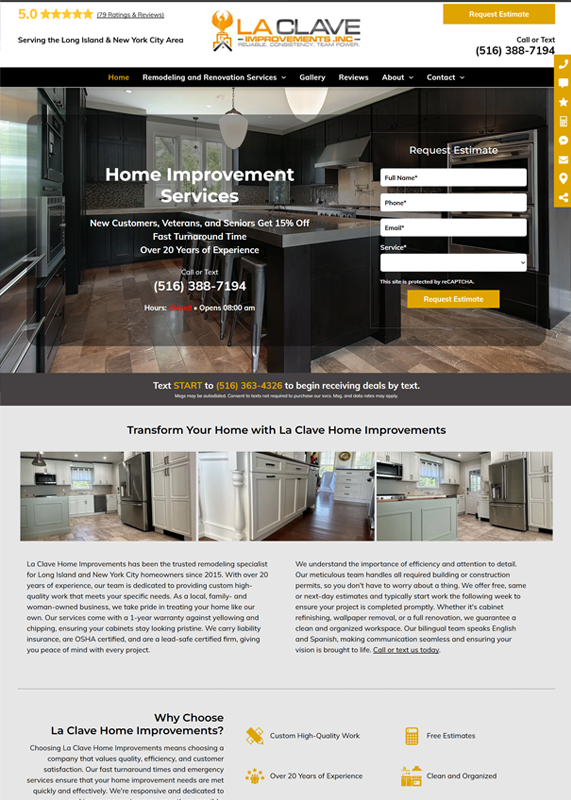
Desktop Design Strengths
This desktop version presents a modern and polished appearance, featuring a well-structured layout and consistent branding that enhances credibility. Call-to-action buttons are prominently positioned, allowing visitors to easily request estimates or get in touch. The inclusion of real project visuals and customer testimonials further strengthens trust and improves overall engagement.
After
Before
Tablet Design Weaknesses
The tablet view appears crowded, with text overlapping the hero section and reducing readability. The navigation menu lacks visibility, which may make it harder for users to browse services. Overall, insufficient spacing and misalignment contribute to a less refined and unfinished appearance.
Tablet Design Strengths
The tablet version appears neat and well-organized, featuring an easily accessible call-to-action form that requires minimal scrolling. The layout adjusts effectively to the smaller screen, maintaining a good balance between text and visuals for clear readability. The right-side icons provide quick navigation shortcuts, improving overall user convenience and experience.
After
Before
Mobile Design Weaknesses
The mobile view is not properly optimized, with text overlapping images and reducing readability. Layout inconsistencies cause sections to appear misaligned, resulting in a cluttered and unprofessional look. Additionally, buttons and navigation elements are not sized appropriately for mobile users, negatively impacting overall usability.
Mobile Design Strengths
The mobile version is well optimized, featuring neatly arranged sections that are easy to scroll and read. Buttons and forms are properly sized for touch interactions, creating a smooth and user-friendly experience. Images paired with brief descriptions keep the design visually engaging while maintaining clarity and usability.
After
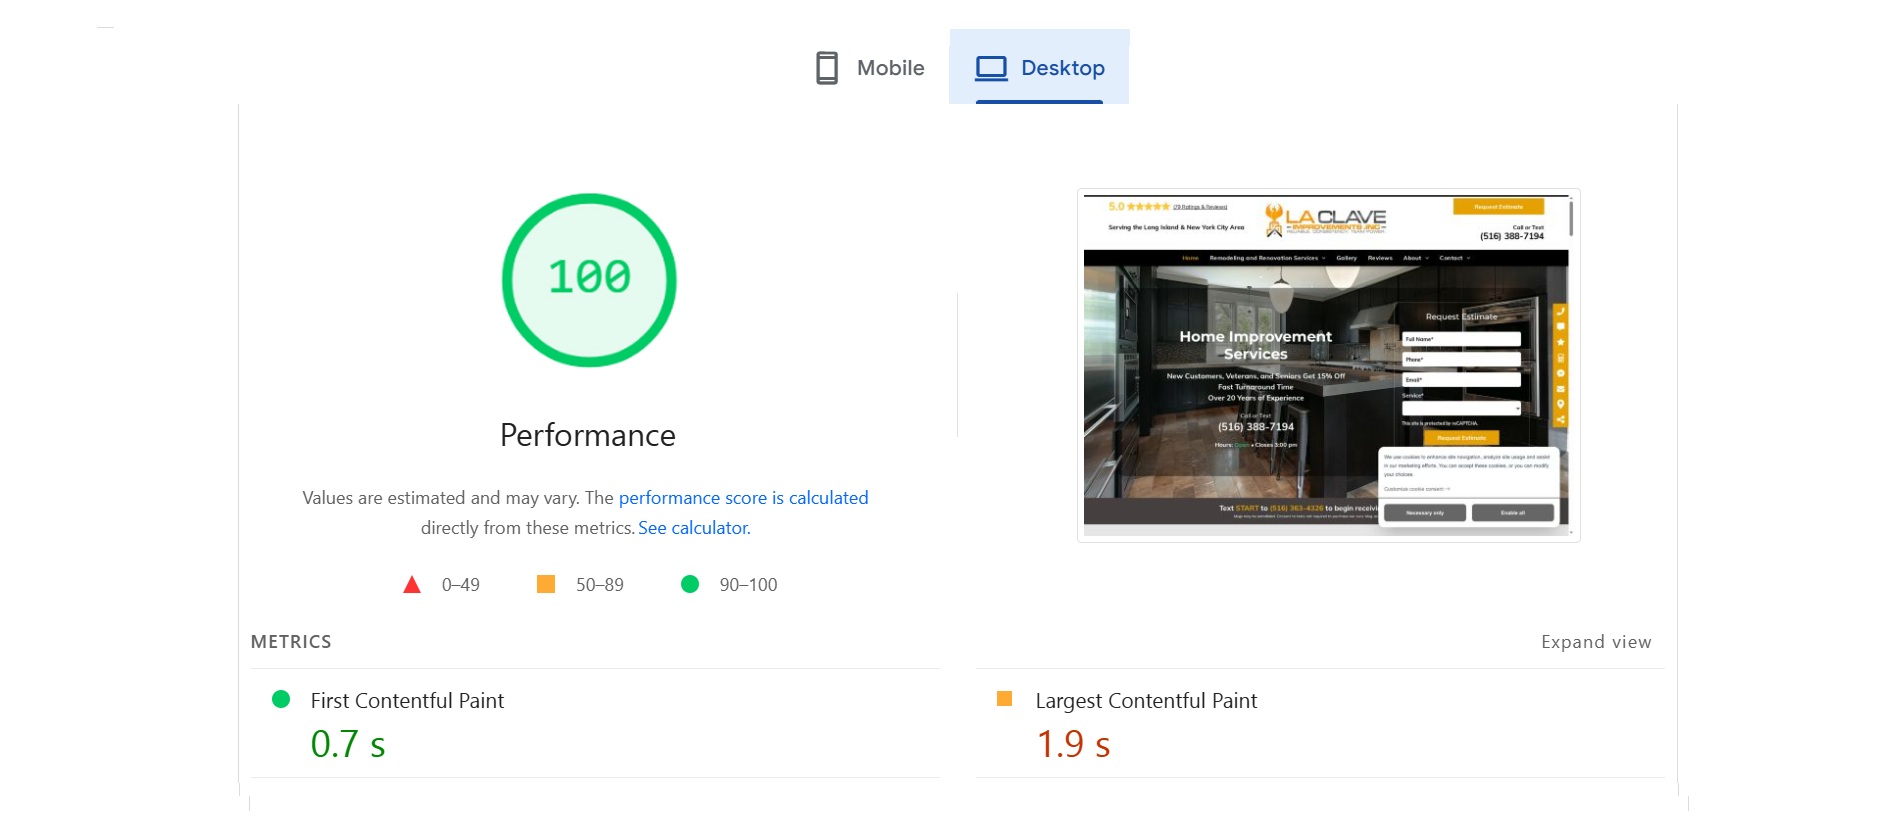
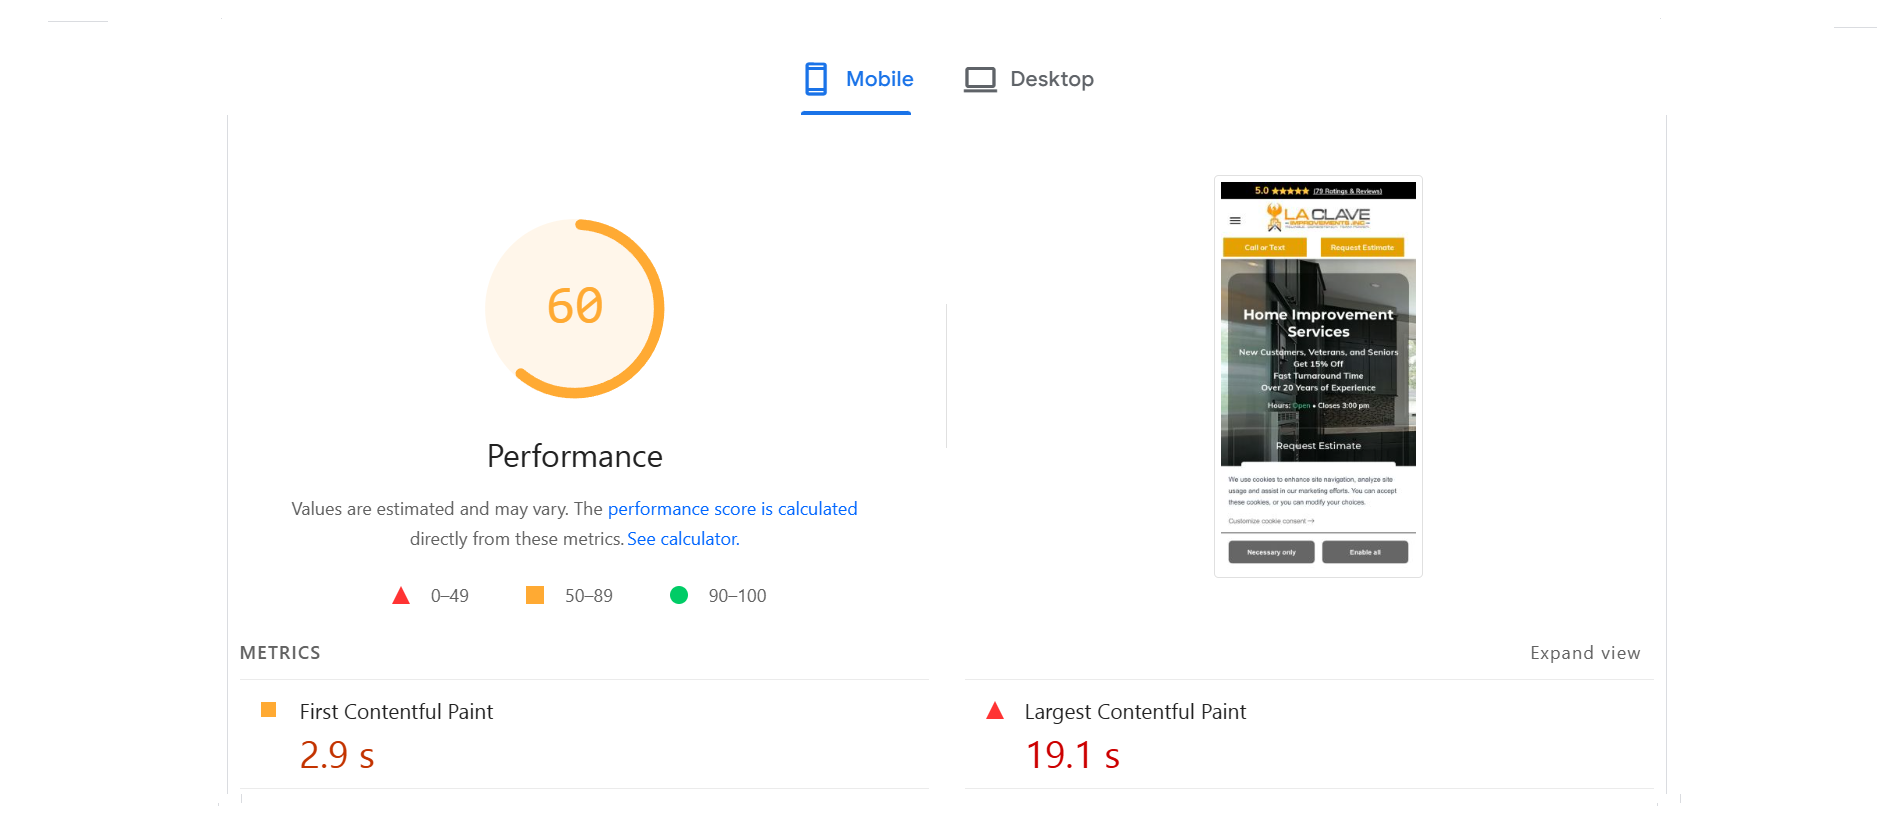
Core Web Vitals Before/After
Desktop
Mobile
SEO Growth Strategy
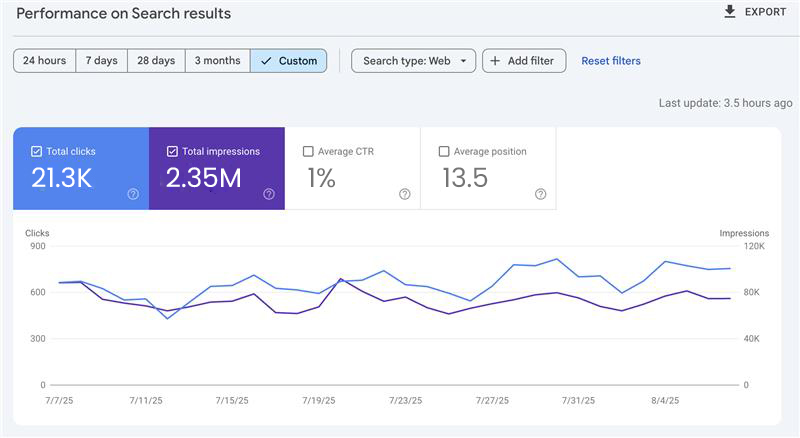
Search Performance Report (One Month After Optimization)
One month after optimization, the website generated 2.35M impressions and 21.3K clicks, showing improved visibility in search results. The average CTR remained at 1%, while the average position improved to 13.5, indicating stronger keyword rankings. Overall performance trends reflect steady growth following the implemented SEO improvements.
Three-Month Search Performance After Optimization
Three months after optimization, the website recorded 5.95M impressions and 59.1K clicks, demonstrating sustained growth in search visibility. The average CTR reached 1.1%, showing gradual improvement in user engagement, while the average position of 14.2 reflects stable keyword rankings. Overall performance trends indicate consistent results from ongoing SEO efforts.
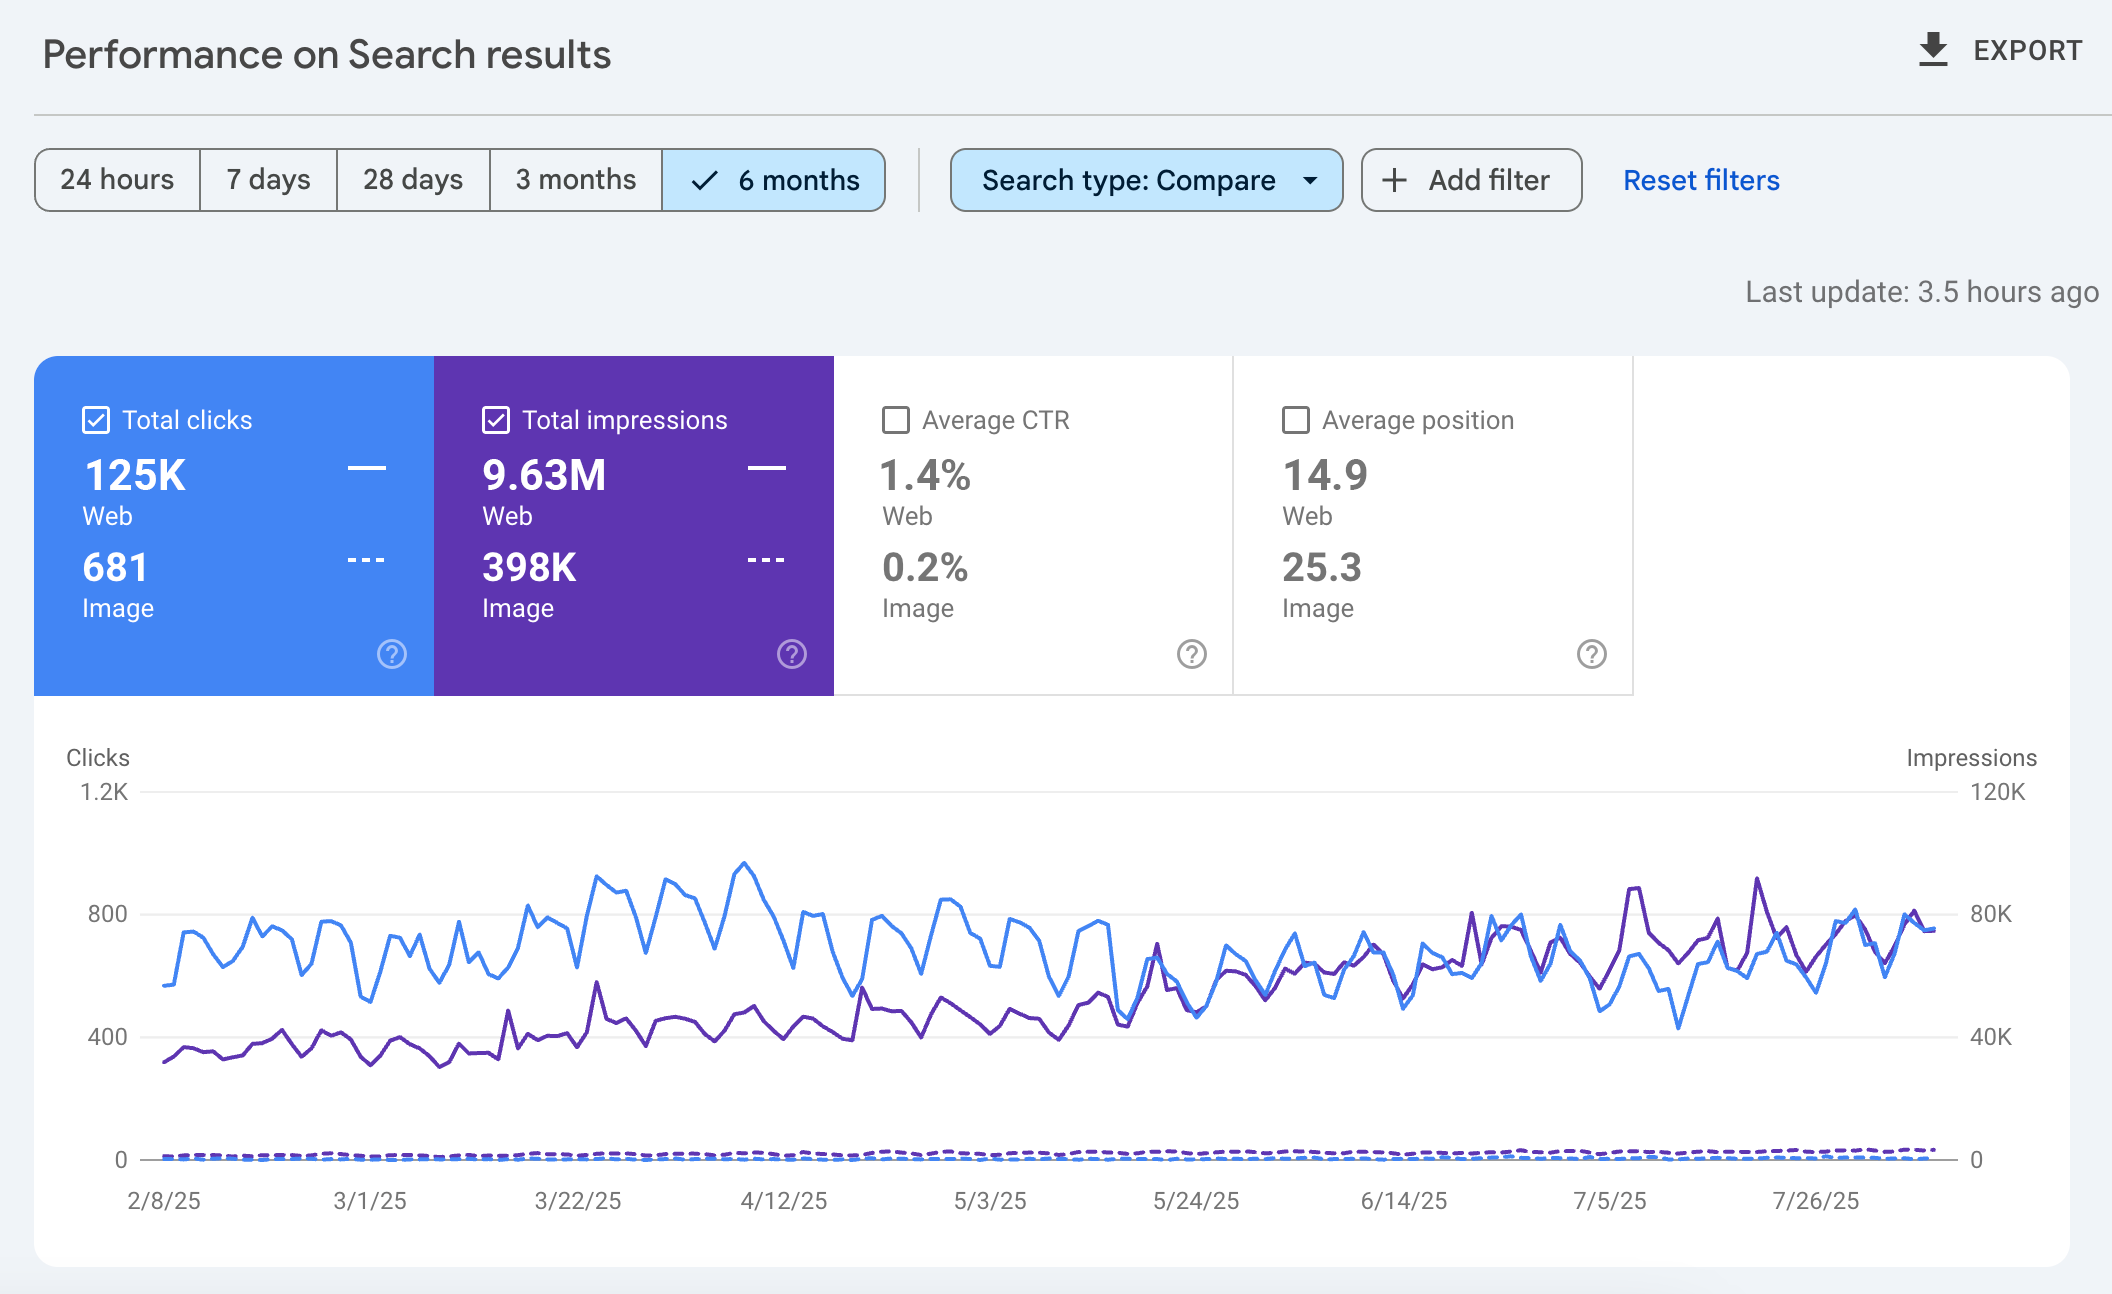
Search Performance Report (Six Months After Optimization)
Six months after optimization, the website achieved 9.63M impressions and 125K clicks, reflecting strong and sustained growth in search visibility. The average CTR improved to 1.4%, indicating better engagement from search users, while the average position of 14.9 shows stable keyword rankings across this period. Overall, the results highlight the long-term effectiveness of the implemented SEO strategies.
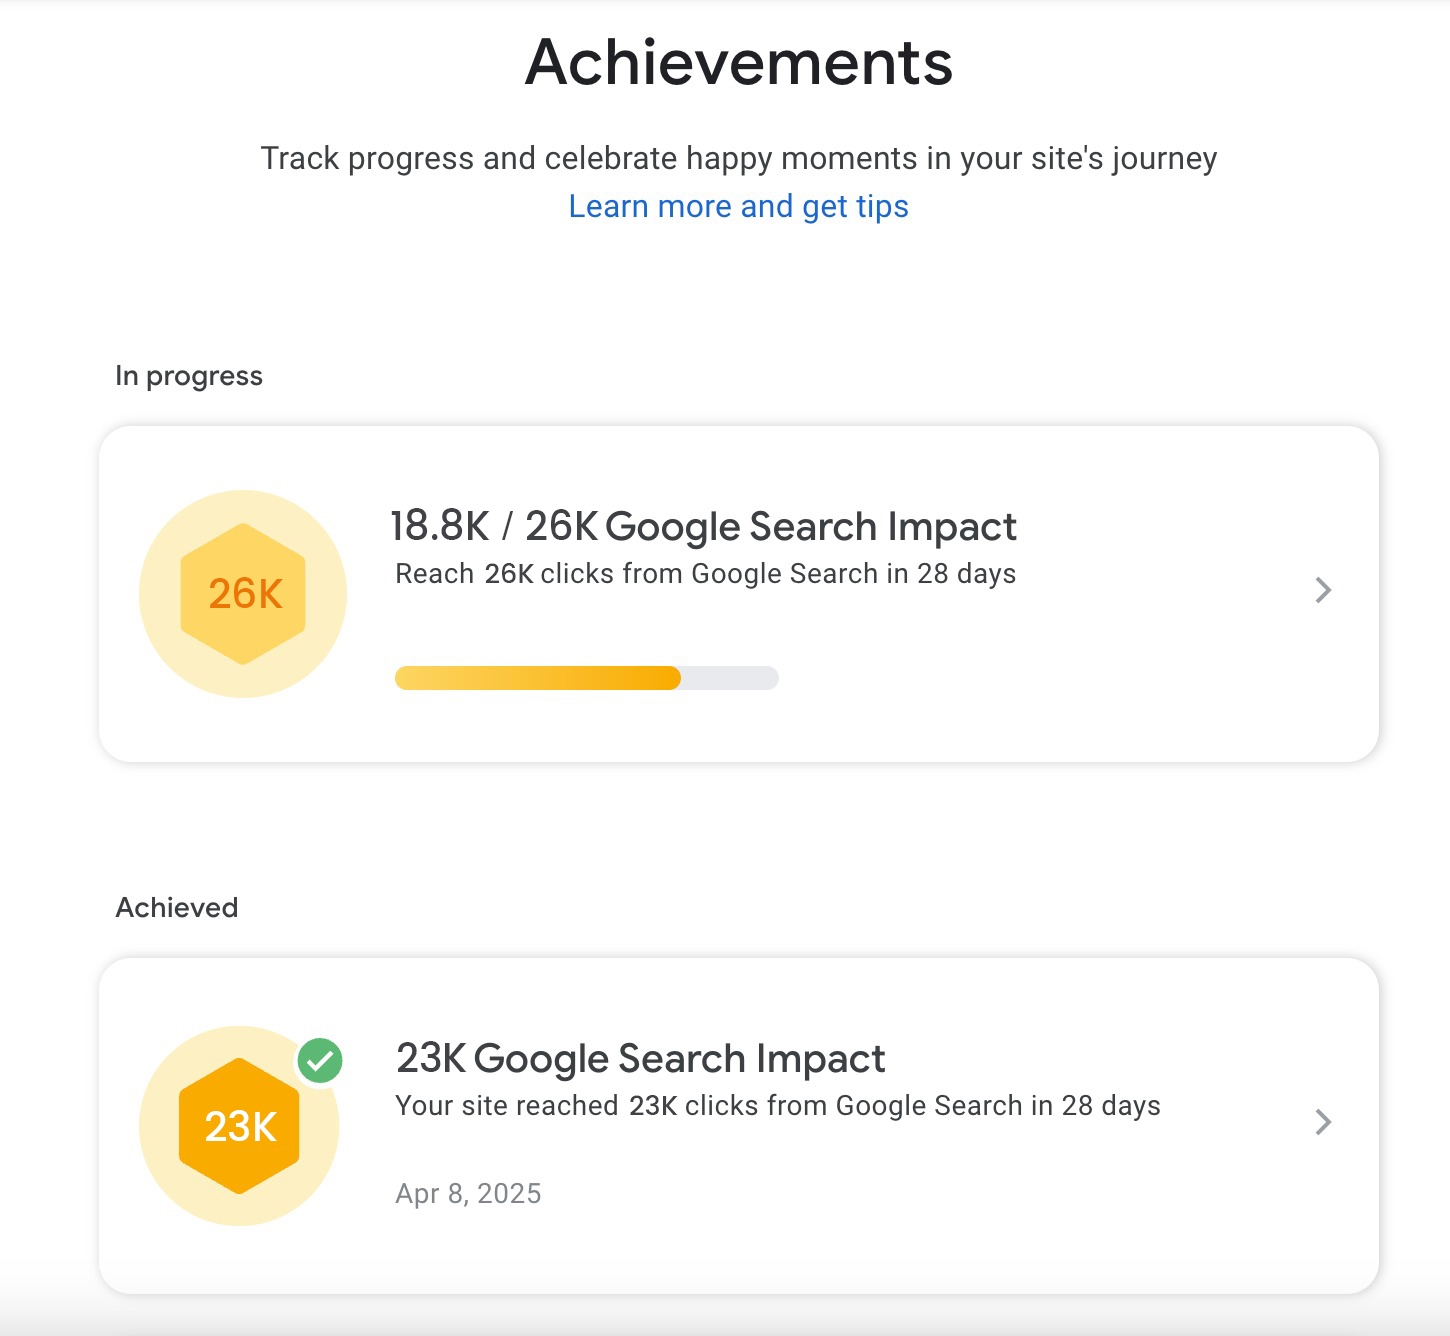
Website Achievement – Google Search Impact (After Optimization)
After optimization, the website reached a Google Search Impact milestone by achieving 23K clicks within a 28-day period and is steadily progressing toward the next target of 26K clicks, with 18.8K already completed. This progress reflects consistent growth in organic search performance and the continued effectiveness of ongoing SEO improvements.
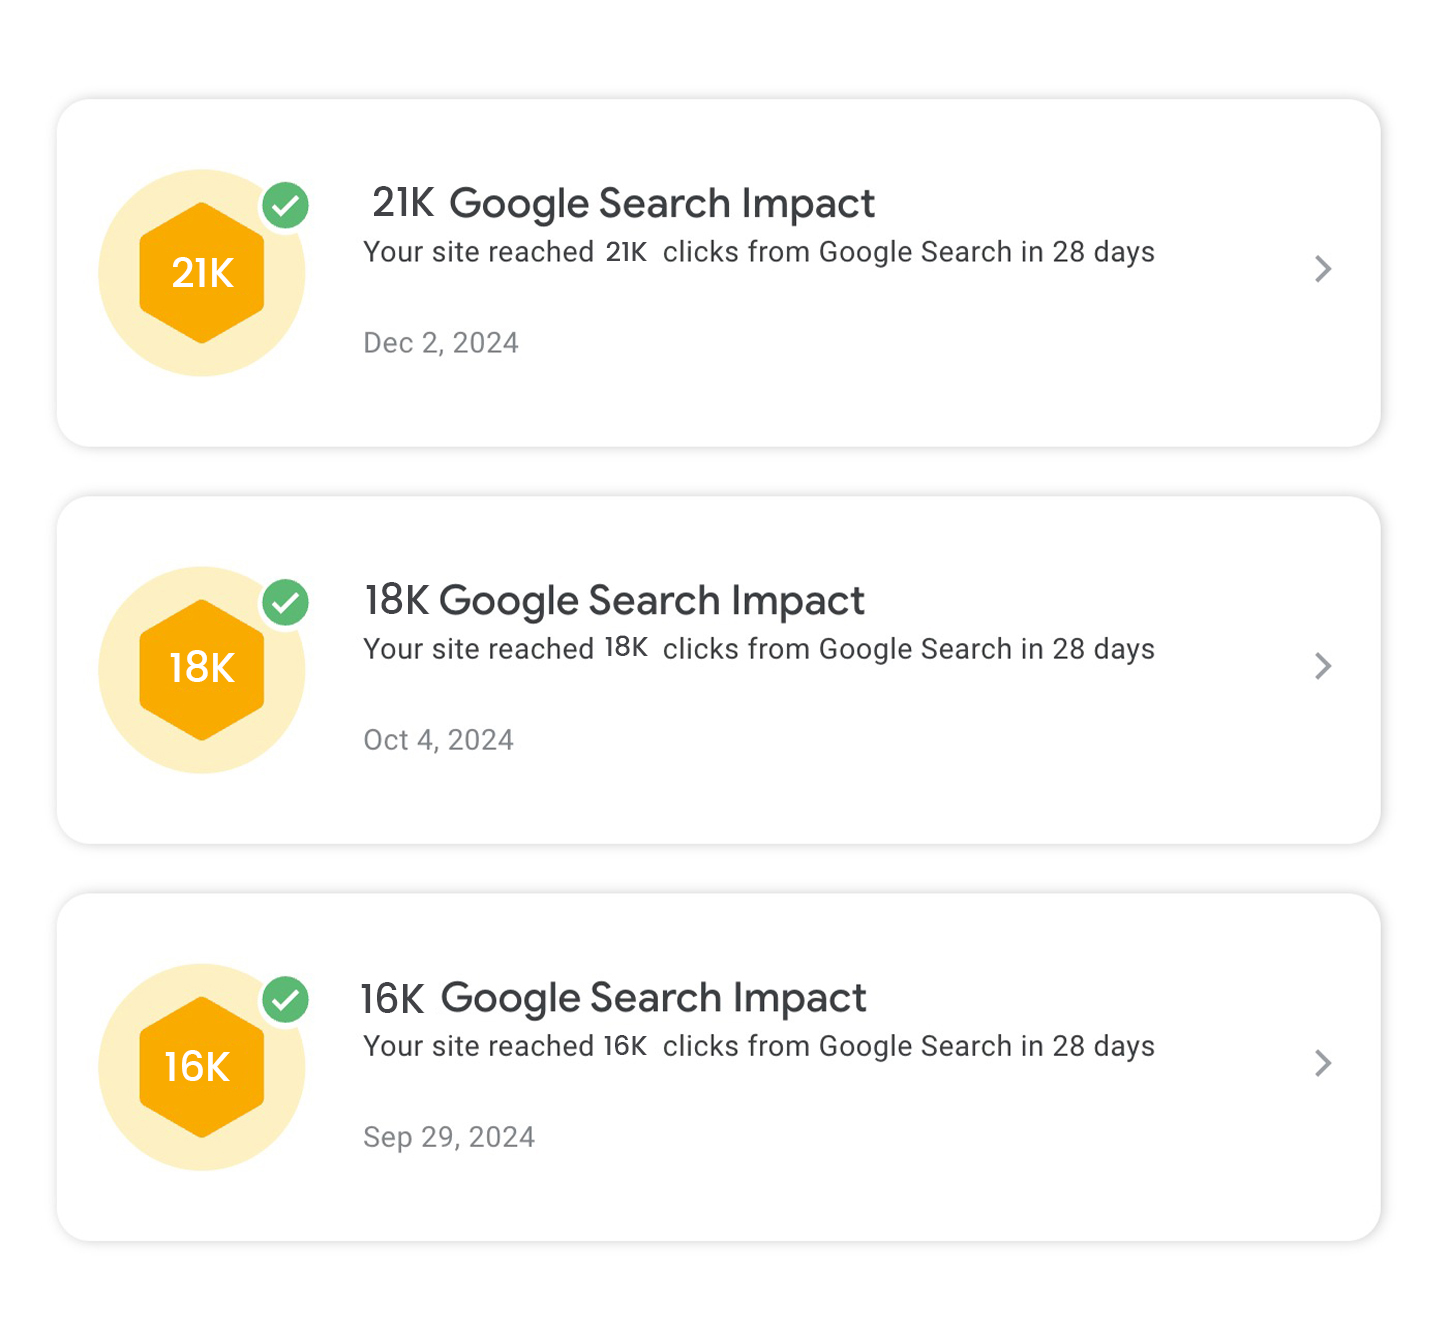
Steady Growth in Google Search Impact
The website demonstrates steady growth in Google Search Impact, progressing from 16K clicks in late September to 18K in October and reaching 21K by December within 28-day periods. This consistent upward trend reflects improving organic visibility, stronger keyword performance, and the ongoing success of SEO optimization efforts.
Website Performance Summary – Last 7 Days
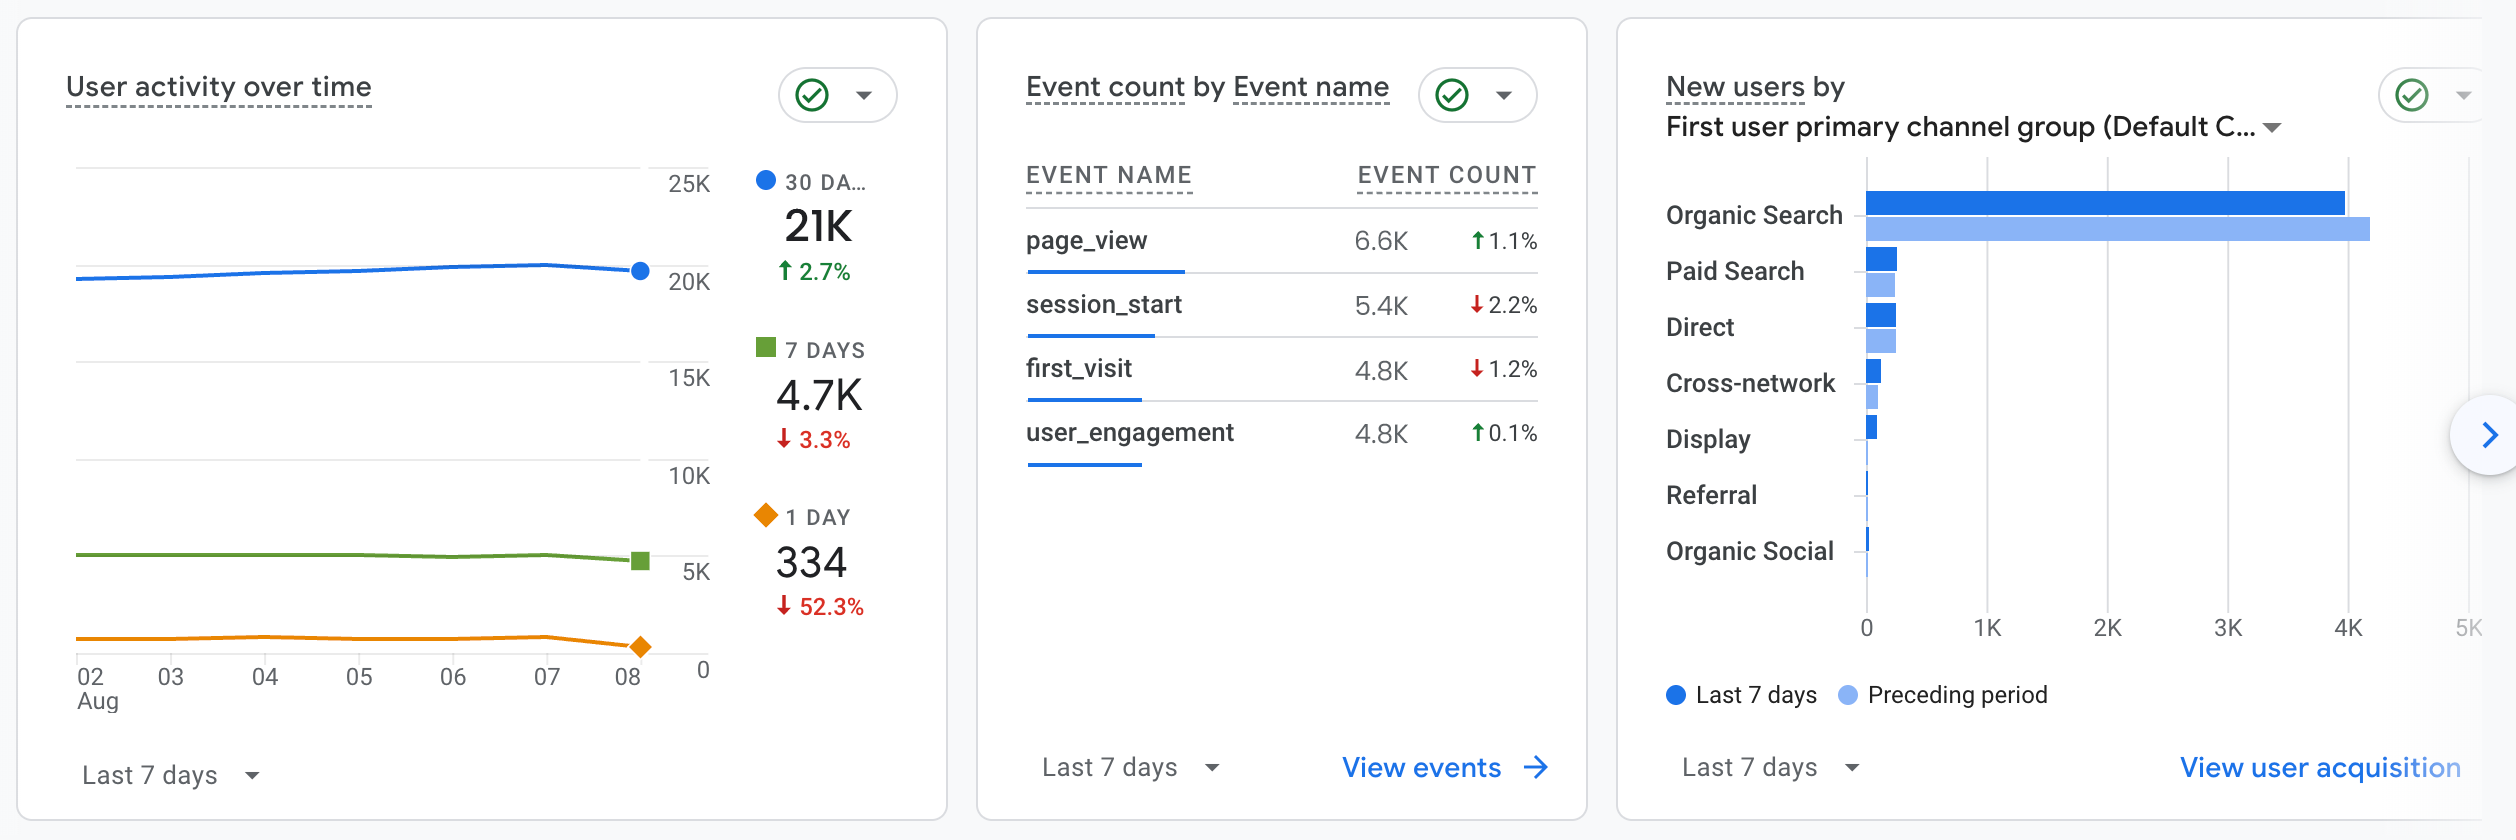
Over the last seven days, the website maintained stable user activity with 21K active users over the past 30 days and 4.7K users in the last week. Key events such as page views, session starts, and user engagement remained consistent, while Organic Search continued to be the dominant source of new users. Overall performance indicates steady engagement with slight short-term fluctuations.
Traffic Summary – Last 7 Days
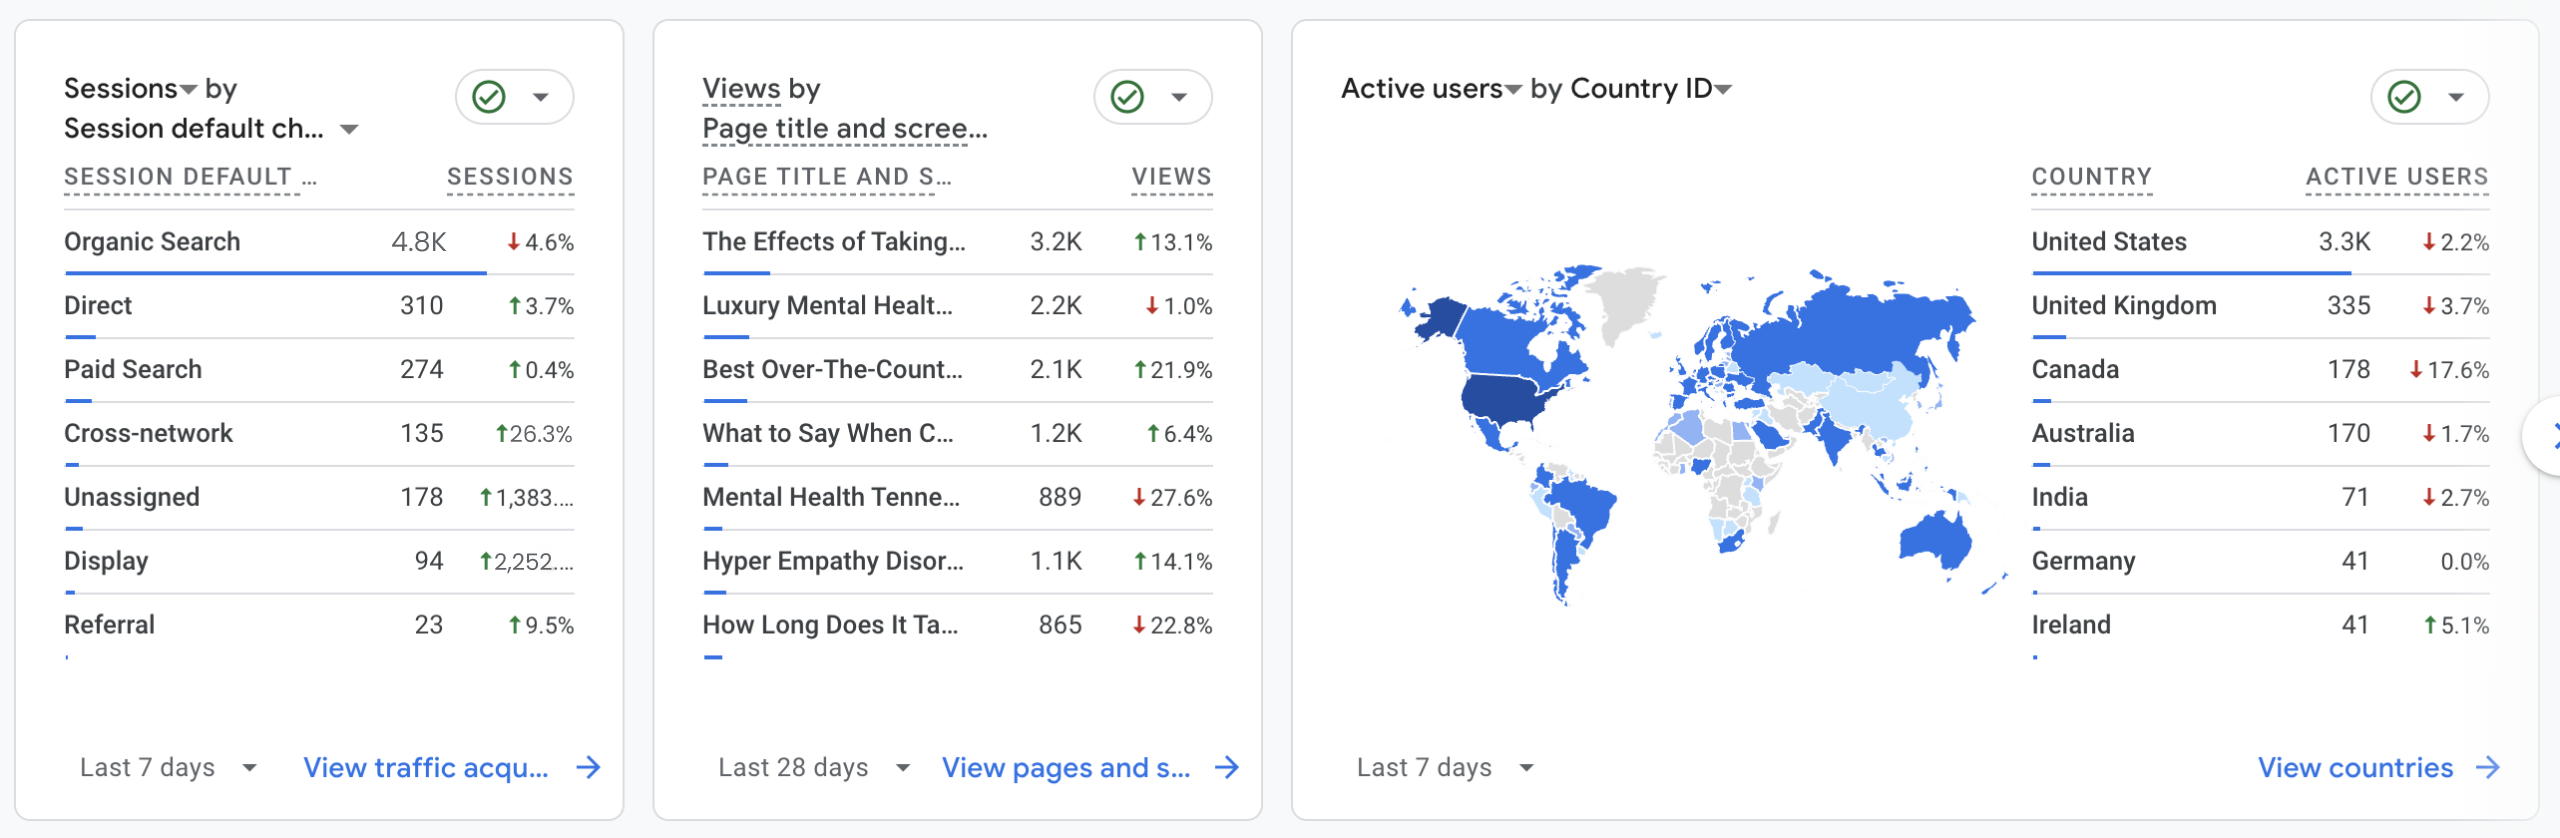
Over the last seven days, Organic Search remained the primary traffic source with 4.8K sessions, supported by Direct and Paid Search traffic. Several top pages showed strong growth in views, indicating increased content engagement. The majority of users came from the United States and the United Kingdom, with additional traffic from Canada and Australia, highlighting a broad and growing international audience.
Website Performance Summary – Last 12 Months
Over the last 12 months, the website showed strong overall growth with 234K active users, 267K sessions, and 319K page views, reflecting consistent improvements across key engagement metrics. Event interactions reached 1.2M, highlighting increased user activity and interaction throughout the year. Overall performance trends indicate sustained growth driven by effective SEO, content, and user experience enhancements.
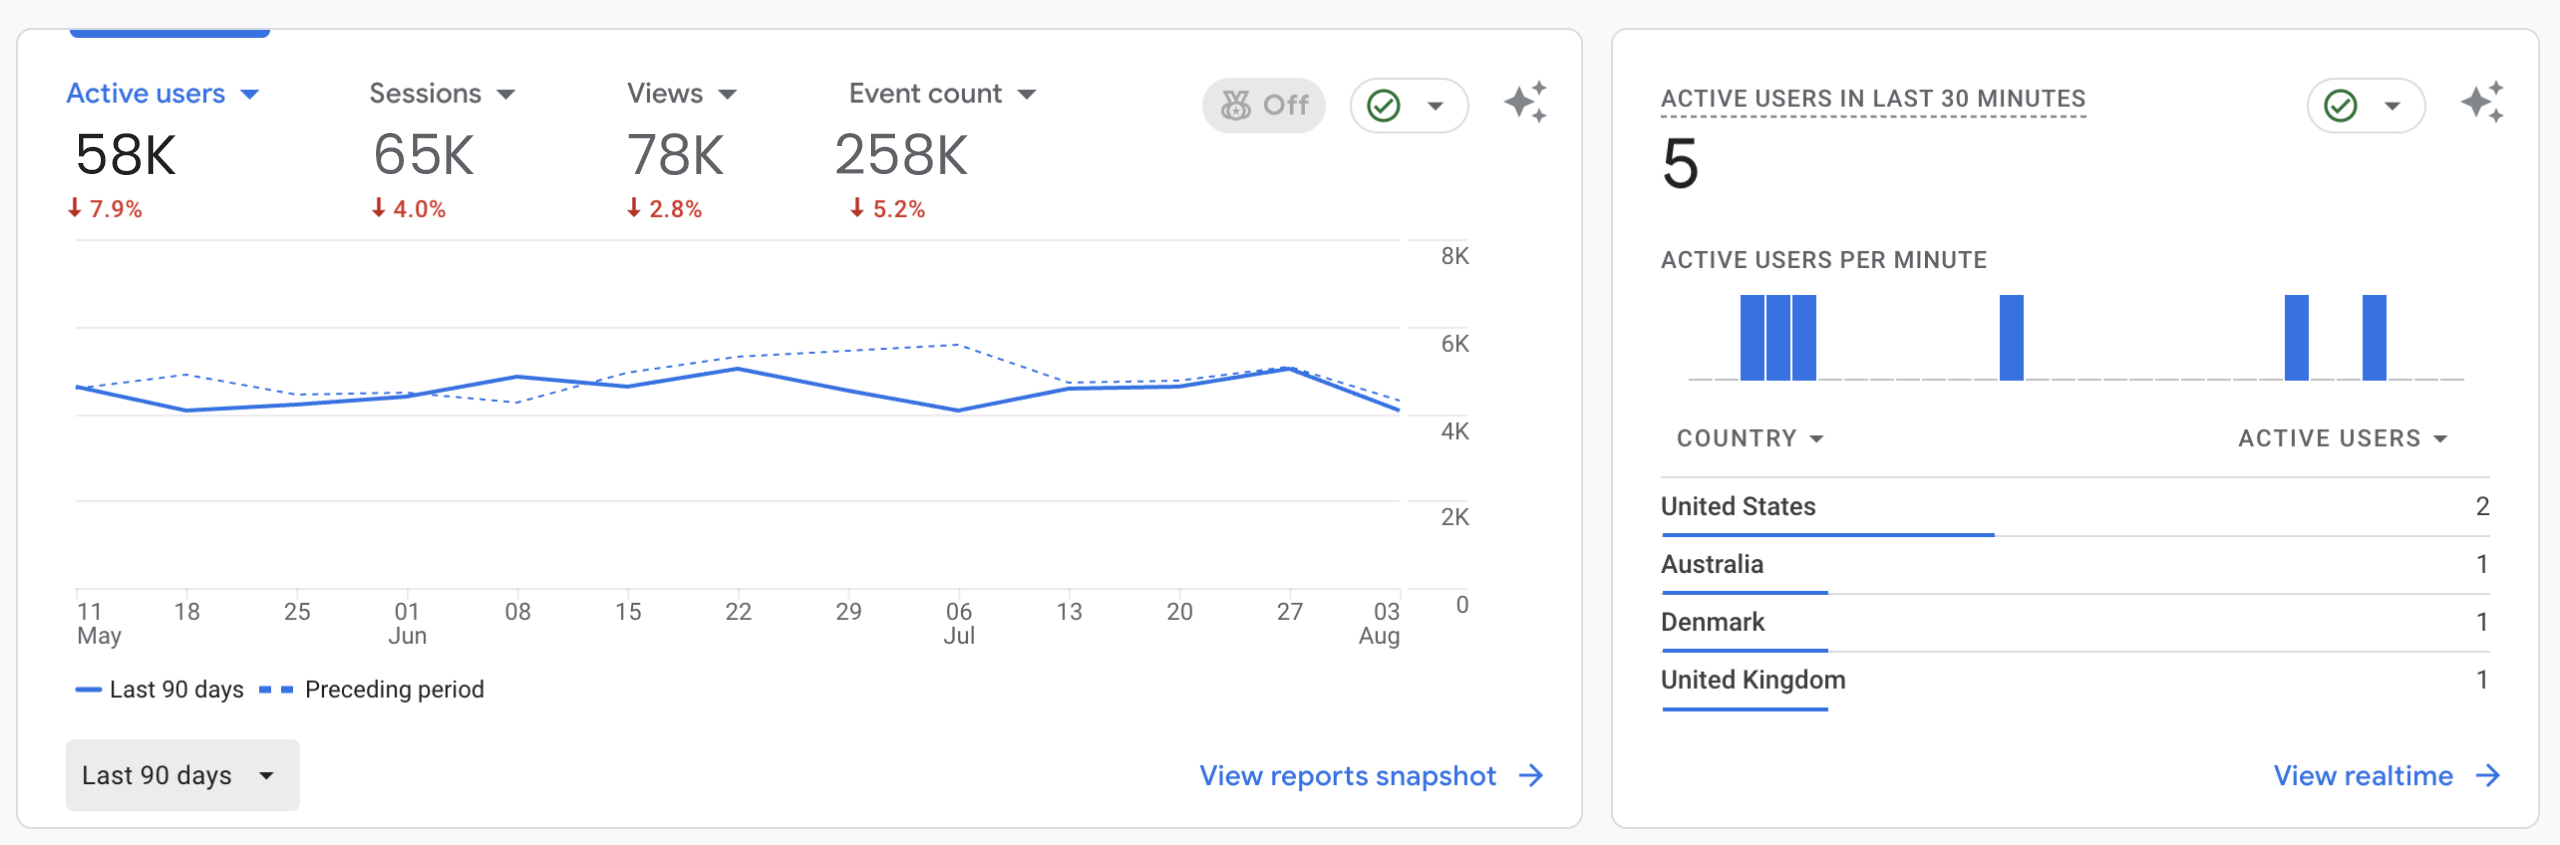
Website Performance Summary – Last 90 Days
Over the last 90 days, the website recorded 58K active users, 65K sessions, and 78K page views, with 258K total events. While there was a slight decline compared to the previous period, overall engagement remained steady. These trends suggest normal performance fluctuations and highlight opportunities to optimize content and traffic strategies to regain growth momentum.
Website Performance Summary – Last 30 Days
Over the last 30 days, the website recorded 21K active users, 22K sessions, and 27K page views, indicating stable traffic levels with slight improvements in engagement. Event activity reached 88K, reflecting consistent user interaction across the site. Despite minor fluctuations compared to the previous period, overall performance remained healthy and steady.