A Grand Hacienda is a large, luxurious estate, often found in regions like Mexico, Spain, or parts of South America. Traditionally, these estates were used for farming or cattle ranching and were designed with wide, open spaces and a blend of rustic and elegant architectural styles. The term “hacienda” comes from the Spanish word for “estate” or “property,” and these buildings often feature grand courtyards, tiled roofs, and expansive gardens. Today, many Grand Haciendas have been converted into hotels or event venues, offering a glimpse into the past while providing modern comforts.
Category
Full-Service Branding, Development & SEO Growth Strategy
Start Date
23 October 2022
Client
Grand Hacienda
Handover
07 June 2023
Regular Medium SemiBold Bold
This Is Text Message Medium Typography Just Amazing Awesome
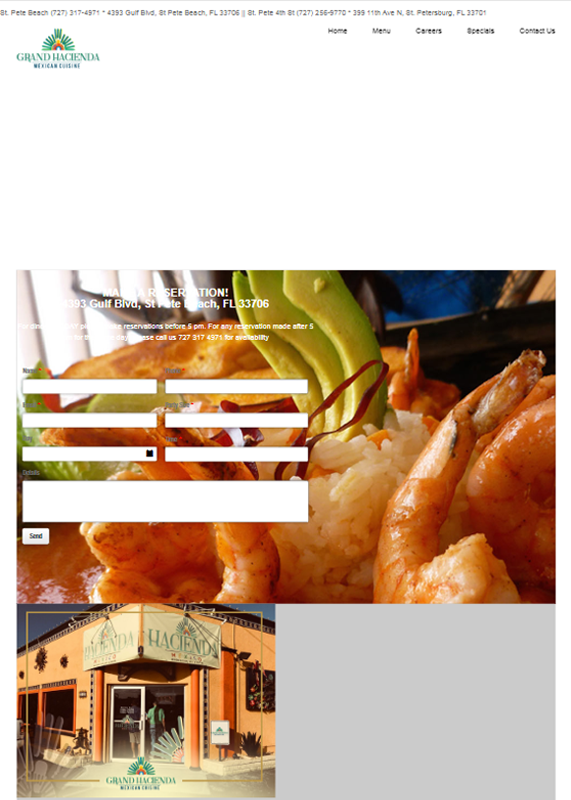
Before
Website Design & Performance Issues
The desktop layout feels outdated and lacks a polished, professional design. The form fields are misaligned over the food image, creating a cluttered and confusing experience. There’s an excess of empty gray space, minimal styling, and weak typography, making the site look unfinished and visually uninspiring.
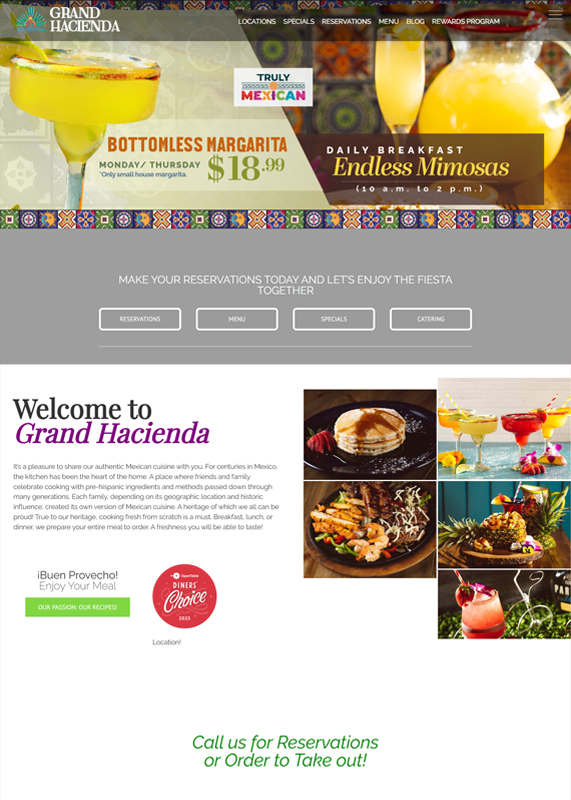
Strong Visual Design & User Trust Elements
The desktop design now feels fresh, modern, and highly engaging. Bold typography, vibrant colors, and high-quality images create an inviting atmosphere that perfectly reflects the restaurant’s lively brand. The well-structured layout features clear calls-to-action for reservations, menus, and specials, making navigation seamless and easy for users to interact with.
After
Before
Website Design & Performance Issues
The tablet view comes across as outdated and lacks refinement. The reservation form dominates the screen, pushing important content down and overwhelming users rather than guiding them. The large food background image is visually heavy, making the text difficult to read. Small, touch-unfriendly navigation links add to the frustration, while the overall design feels unbalanced and unpolished.
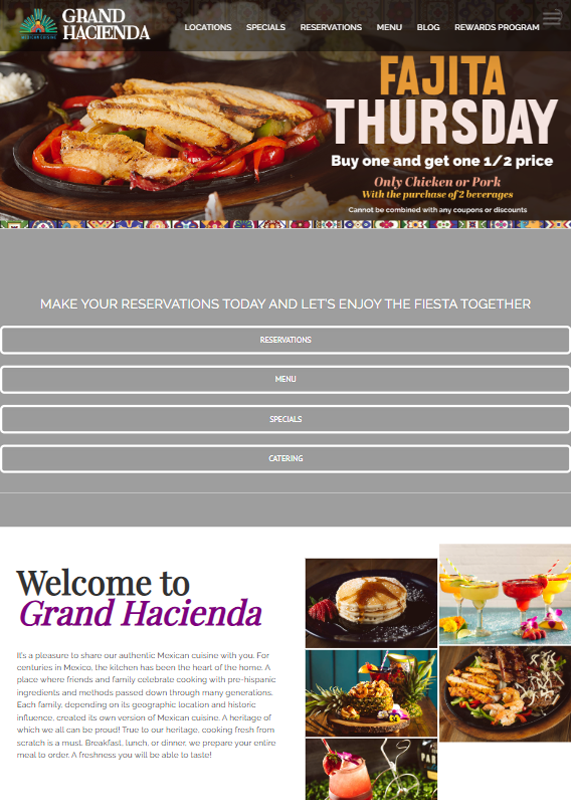
Strong Visual Design & User Trust Elements
The new tablet layout feels vibrant, modern, and organized. A bold banner featuring promotions like “Fajita Thursday” grabs attention right away, keeping visitors engaged. Navigation is easily accessible at the top and optimized for touch, while large buttons for Reservations, Menu, Specials, and Catering guide users with clarity. The “Welcome” section strikes a perfect balance with colorful food images and inviting text, creating an overall polished and welcoming design that’s perfect for tablet users.
After
Before
Website Design & Performance Issues
The old mobile view feels outdated and poorly optimized. The cluttered layout, small fonts, and white text on busy food images make it hard to read. Navigation is confusing, as the menu consists of plain text links rather than a mobile-friendly bar or hamburger menu. The reservation form takes up too much space, overshadowing the rest of the content, and key call-to-action buttons like “Order Today” or “Make a Reservation” fail to grab attention. Inconsistent spacing and visuals further detract from the user experience, making it frustrating to navigate.
Strong Visual Design & User Trust Elements
The new mobile design is fresh, intuitive, and user-friendly. A clean layout highlights essential actions like reservations, store pages, and directions with bold green buttons that stand out. The hamburger menu ensures navigation is simple and uncluttered, while the prominent call-to-action text, “Call us for Reservations or Order to Take out!”, invites users to take action. Locations are neatly listed with contact details, making it easy to access important information with minimal scrolling. Overall, the design feels professional, visually appealing, and makes the mobile experience smooth and accessible.
After
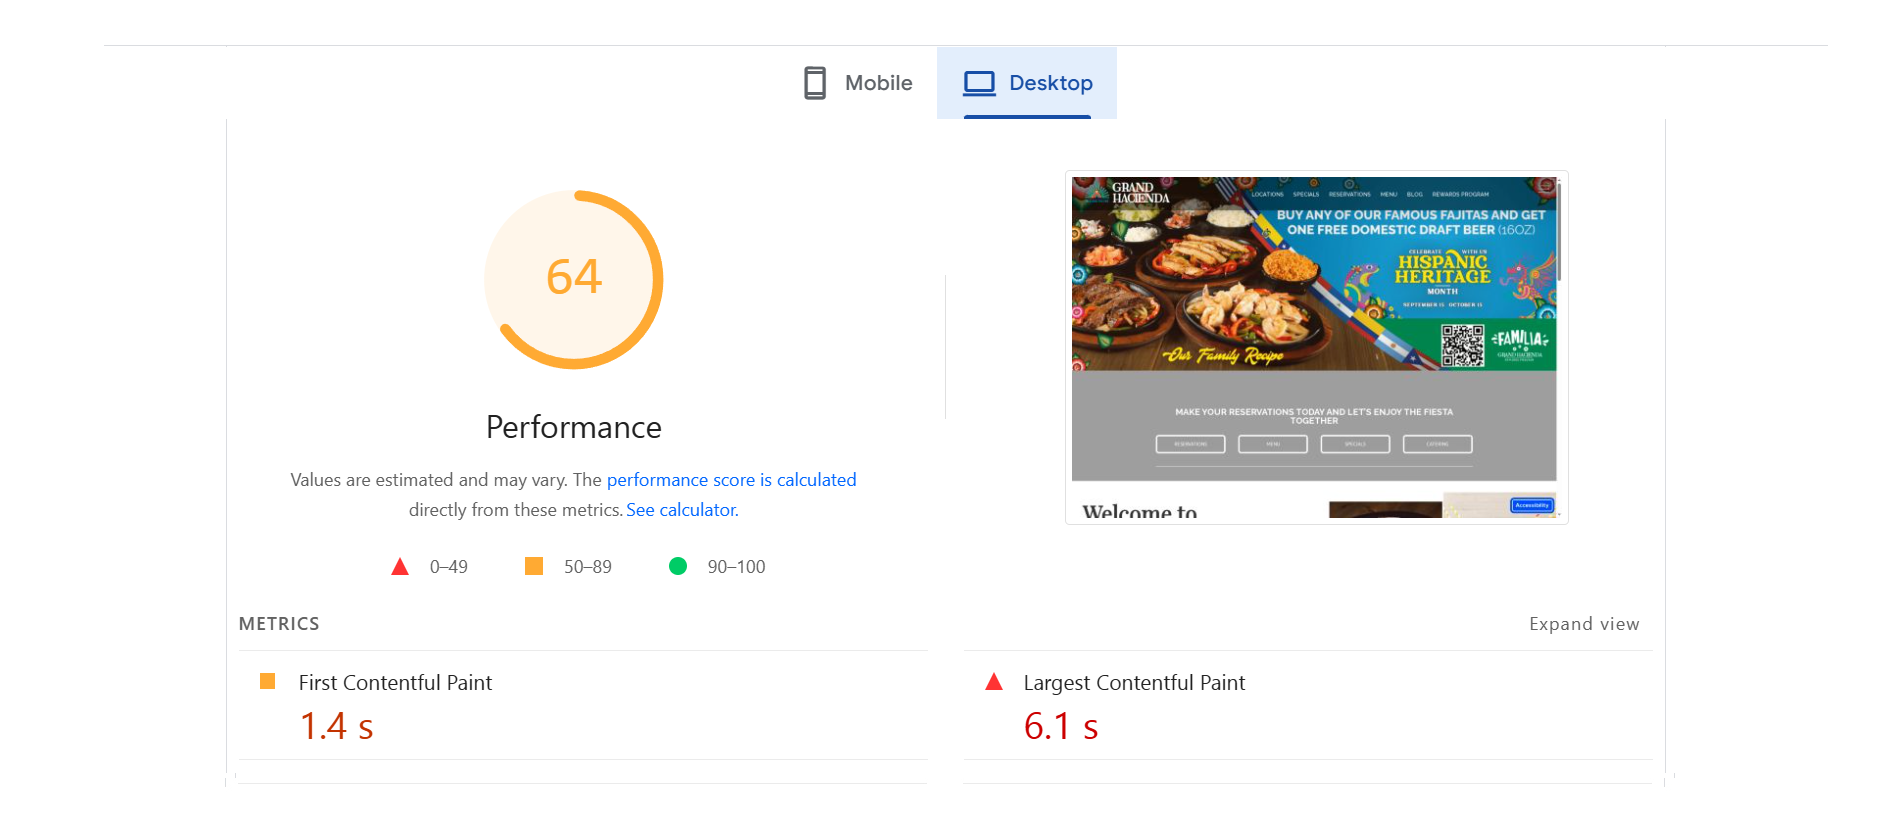
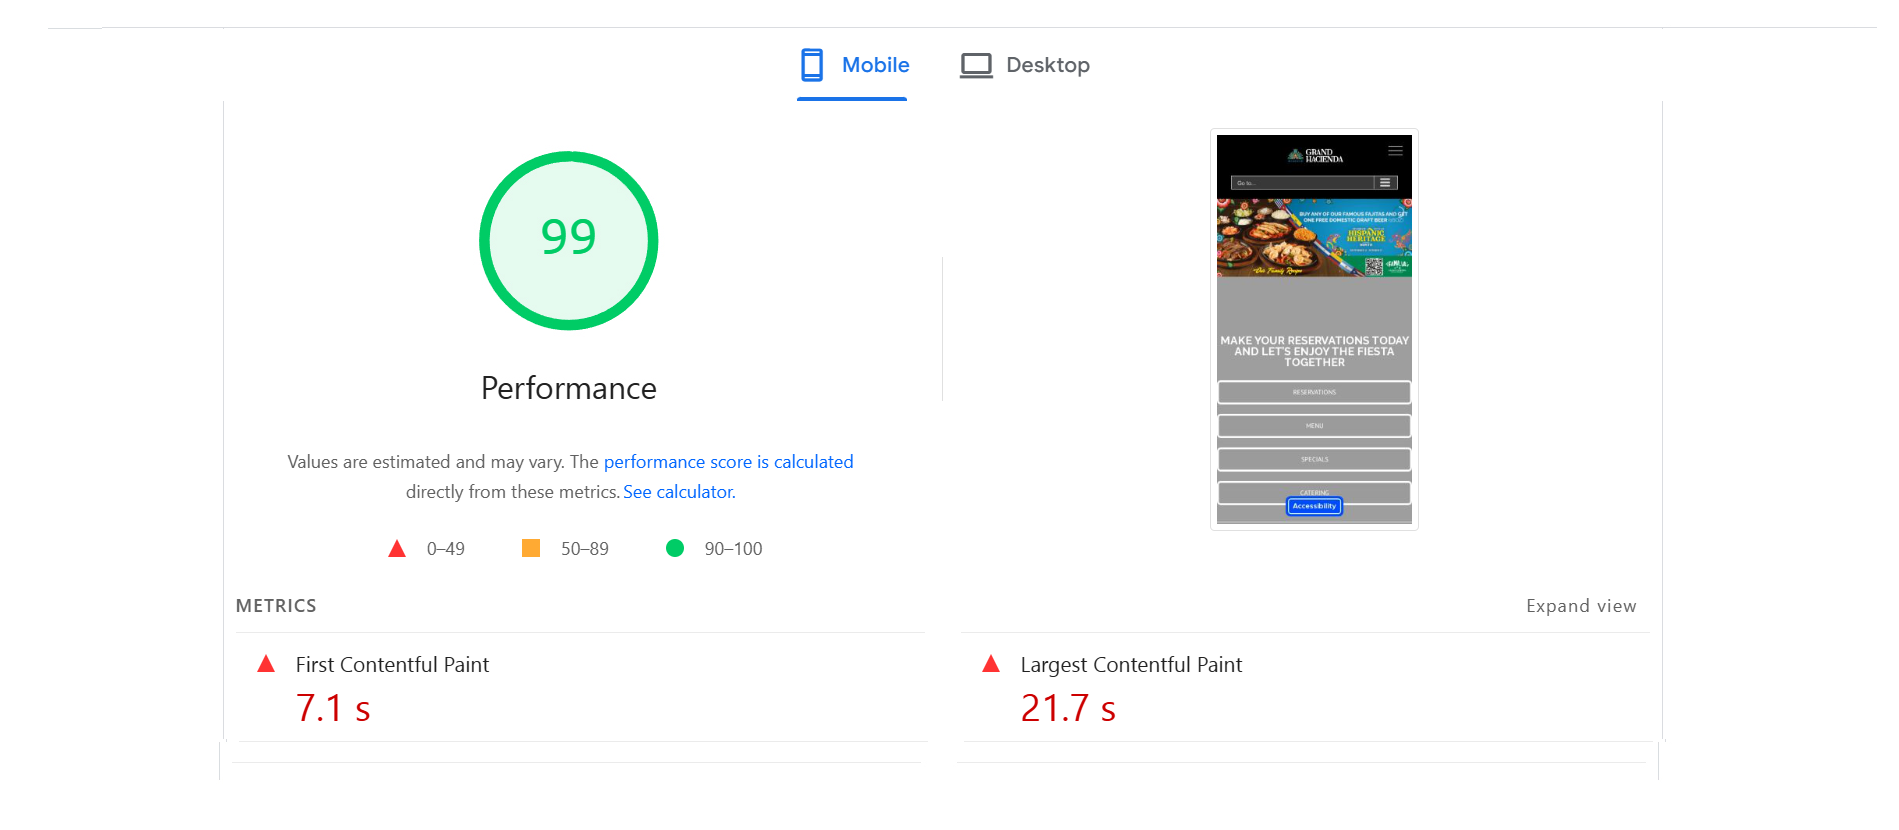
Core Web Vitals Before/After
Desktop
Mobile
SEO Growth Strategy
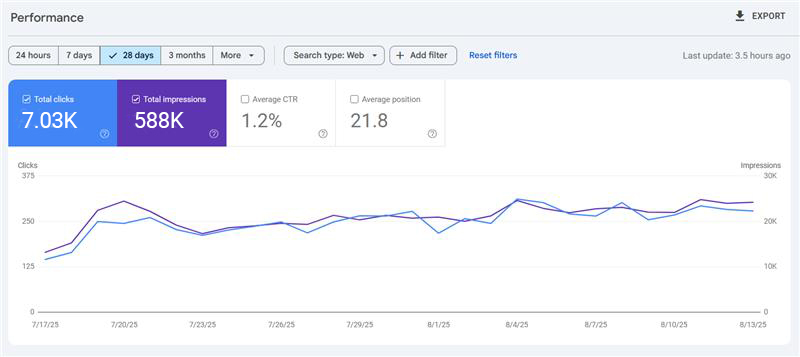
Search Performance Report (28 Days Overview)
For the past 28 days, with a total of 7.03 thousand clicks and 588,000 impressions. The average click-through rate (CTR) is 1.2%, and the average position is 21.8. The chart illustrates consistent fluctuations in both clicks and impressions, with occasional peaks and dips. Overall, the site appears to have a steady level of engagement over the period.
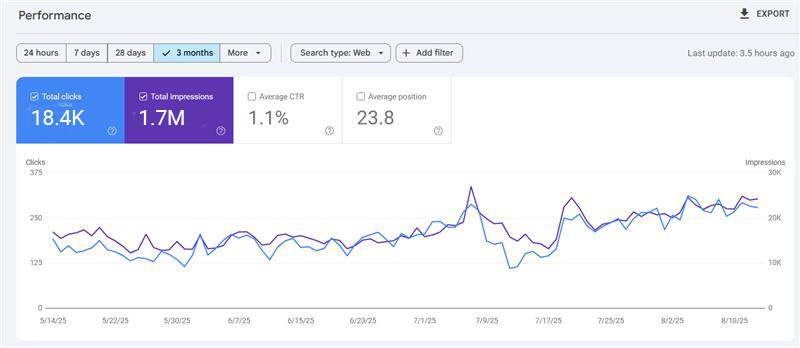
Three-Month Search Performance After Optimization
This three-month performance report shows a total of 18.4K clicks and 1.7M impressions. The average click-through rate (CTR) is 1.1%, and the average position is 23.8. The chart highlights some fluctuations in clicks and impressions, but there’s a noticeable upward trend, especially in the latter half of the period, indicating that optimization efforts are likely starting to have a positive impact.
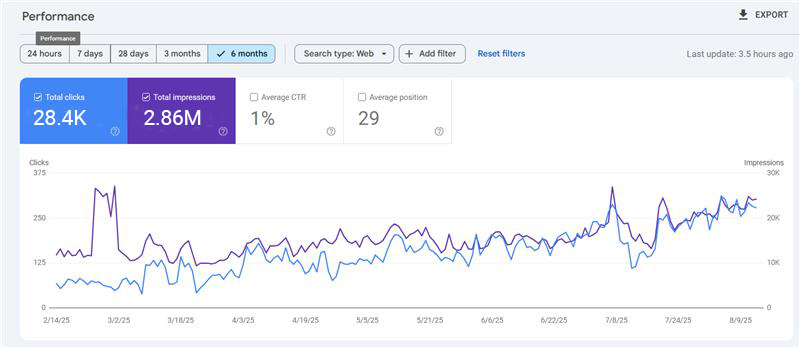
Search Performance Report (Six Months After Optimization)
The six-month search performance report shows a total of 28.4K clicks and 2.86M impressions. The average click-through rate (CTR) is 1%, and the average position is 29. The chart demonstrates a significant upward trend in both clicks and impressions, with noticeable peaks in the later months. This indicates that the optimization efforts have led to increased visibility and engagement over the past six months.
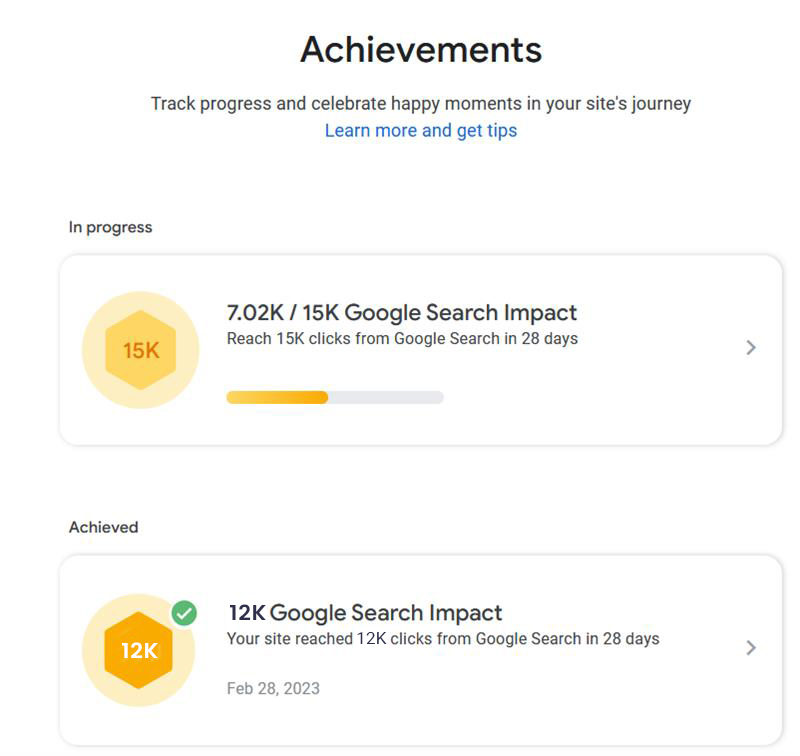
Website Achievement – Google Search Impact (After Optimization)
The number of clicks the site received from Google Search over a 28-day period. The website is currently working towards reaching 15K clicks, with 7.02K already achieved. Additionally, the site successfully reached 12K clicks in a previous period, indicating that optimization efforts have improved its visibility and performance in search results. This progress reflects effective SEO strategies that continue to drive traffic to the site.
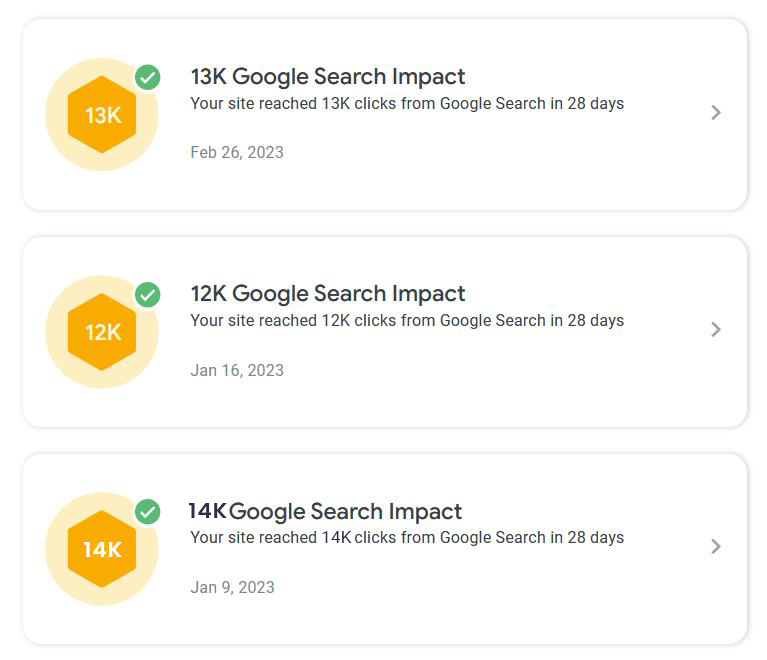
Steady Growth in Google Search Impact
It shows a series of milestones, with the site reaching 14K clicks on January 9, 2023, followed by 12K clicks on January 16, and then reaching 13K clicks on February 26, 2023. These achievements demonstrate consistent improvement in the site’s performance in search results, likely due to ongoing SEO efforts, leading to increased traffic and visibility. This steady progress reflects the effectiveness of optimization strategies over the months.
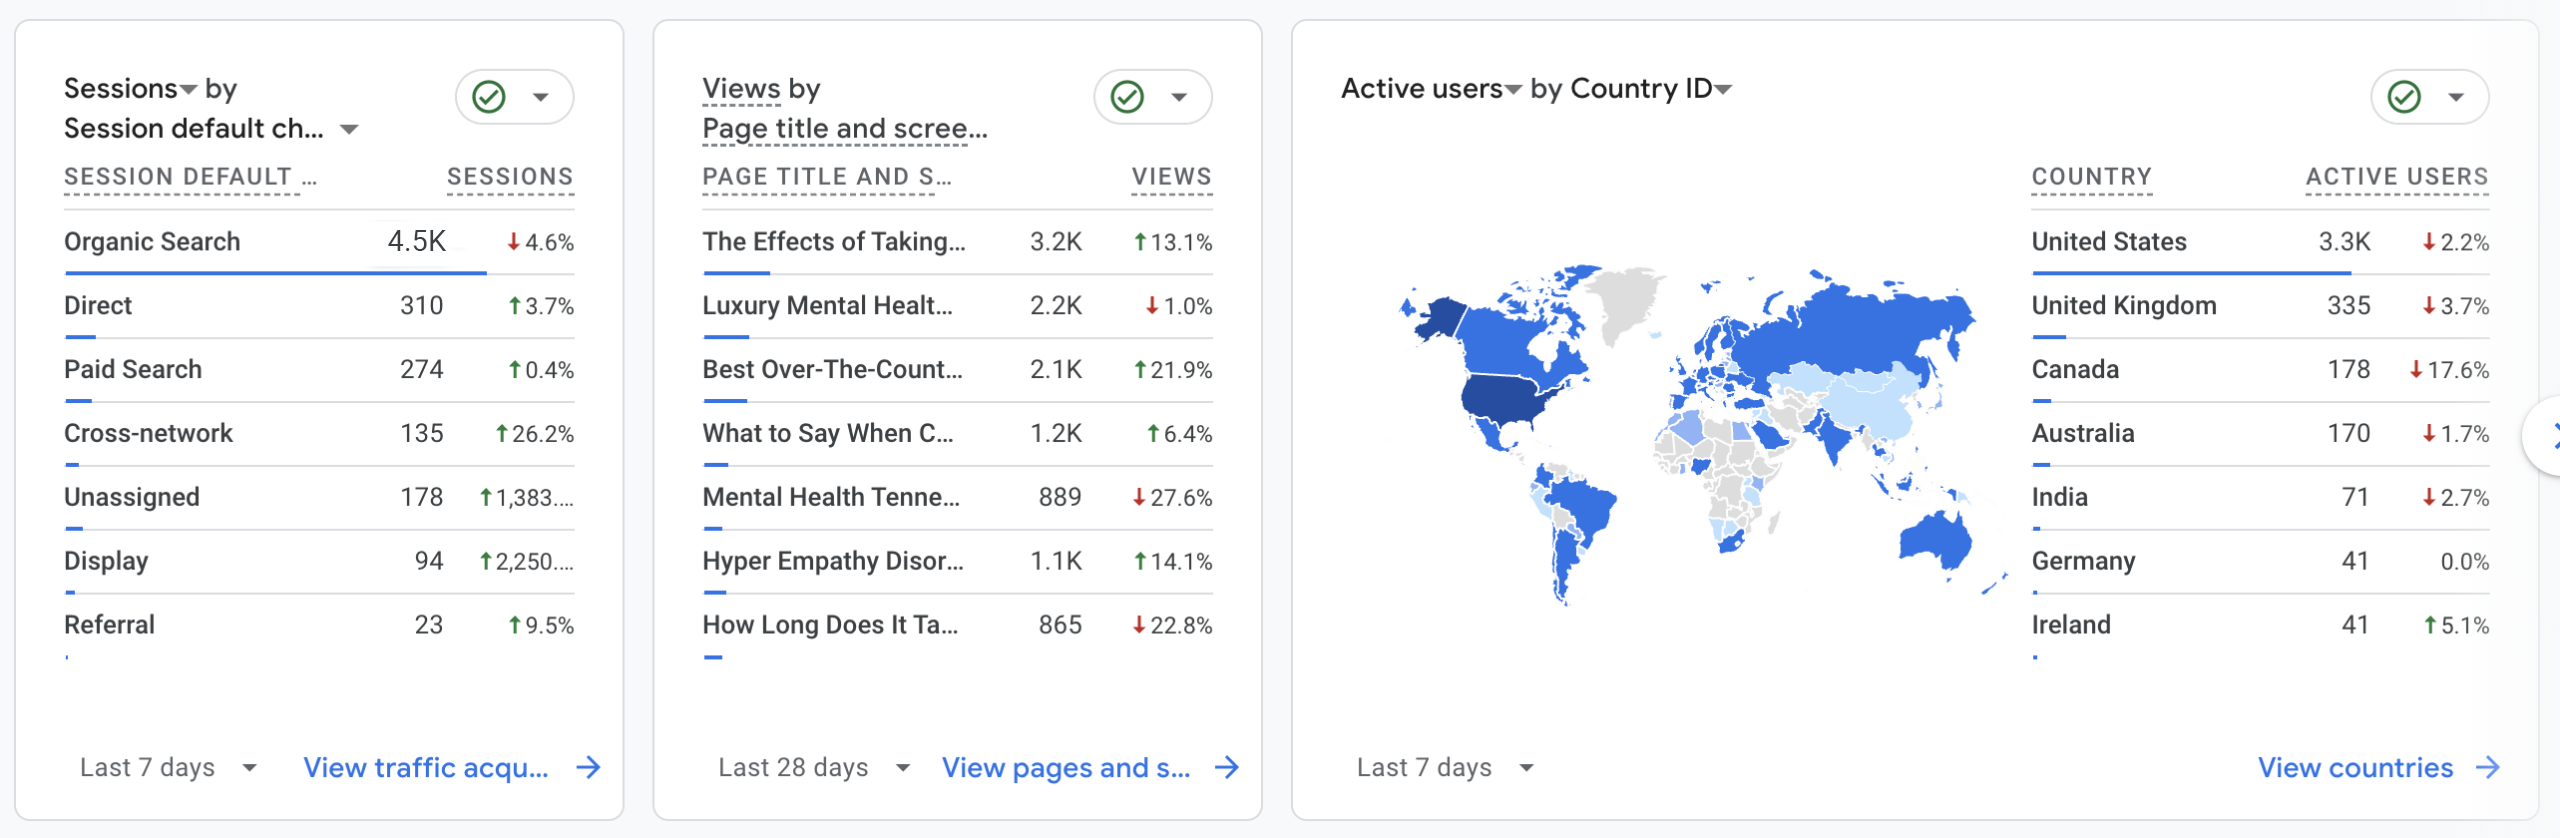
Website Performance Summary – Last 7 Days
Over the last 7 days. Organic Search is the top traffic source, bringing in 4.5K sessions with a 4.6% increase. The page titled “The Effects of Taking…” has the most views at 3.2K, and the majority of active users come from the United States (3.3K). Overall, the data shows steady growth and good user engagement.
Website Performance Summary — Last 30 Days
Over the last 30 days, with Organic Search bringing in the highest number of sessions (4.5K). The most viewed page recorded 3.2K views, showing strong engagement with key content. Active users are mostly from the United States, followed by the United Kingdom and Canada. Overall, the data reflects consistent traffic growth and steady global interest in the site.
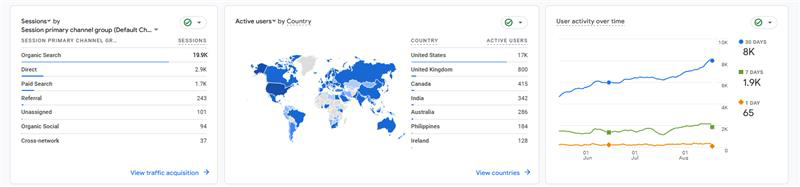
Website Performance Summary — Last 90 Days
Over the last 90 days. Organic Search is the leading traffic source with 19.9K sessions, followed by Direct traffic with 2.9K sessions. The majority of active users come from the United States, with notable traffic also from the United Kingdom, Canada, and India. The user activity graph shows steady growth over time, indicating consistent performance and increasing engagement.
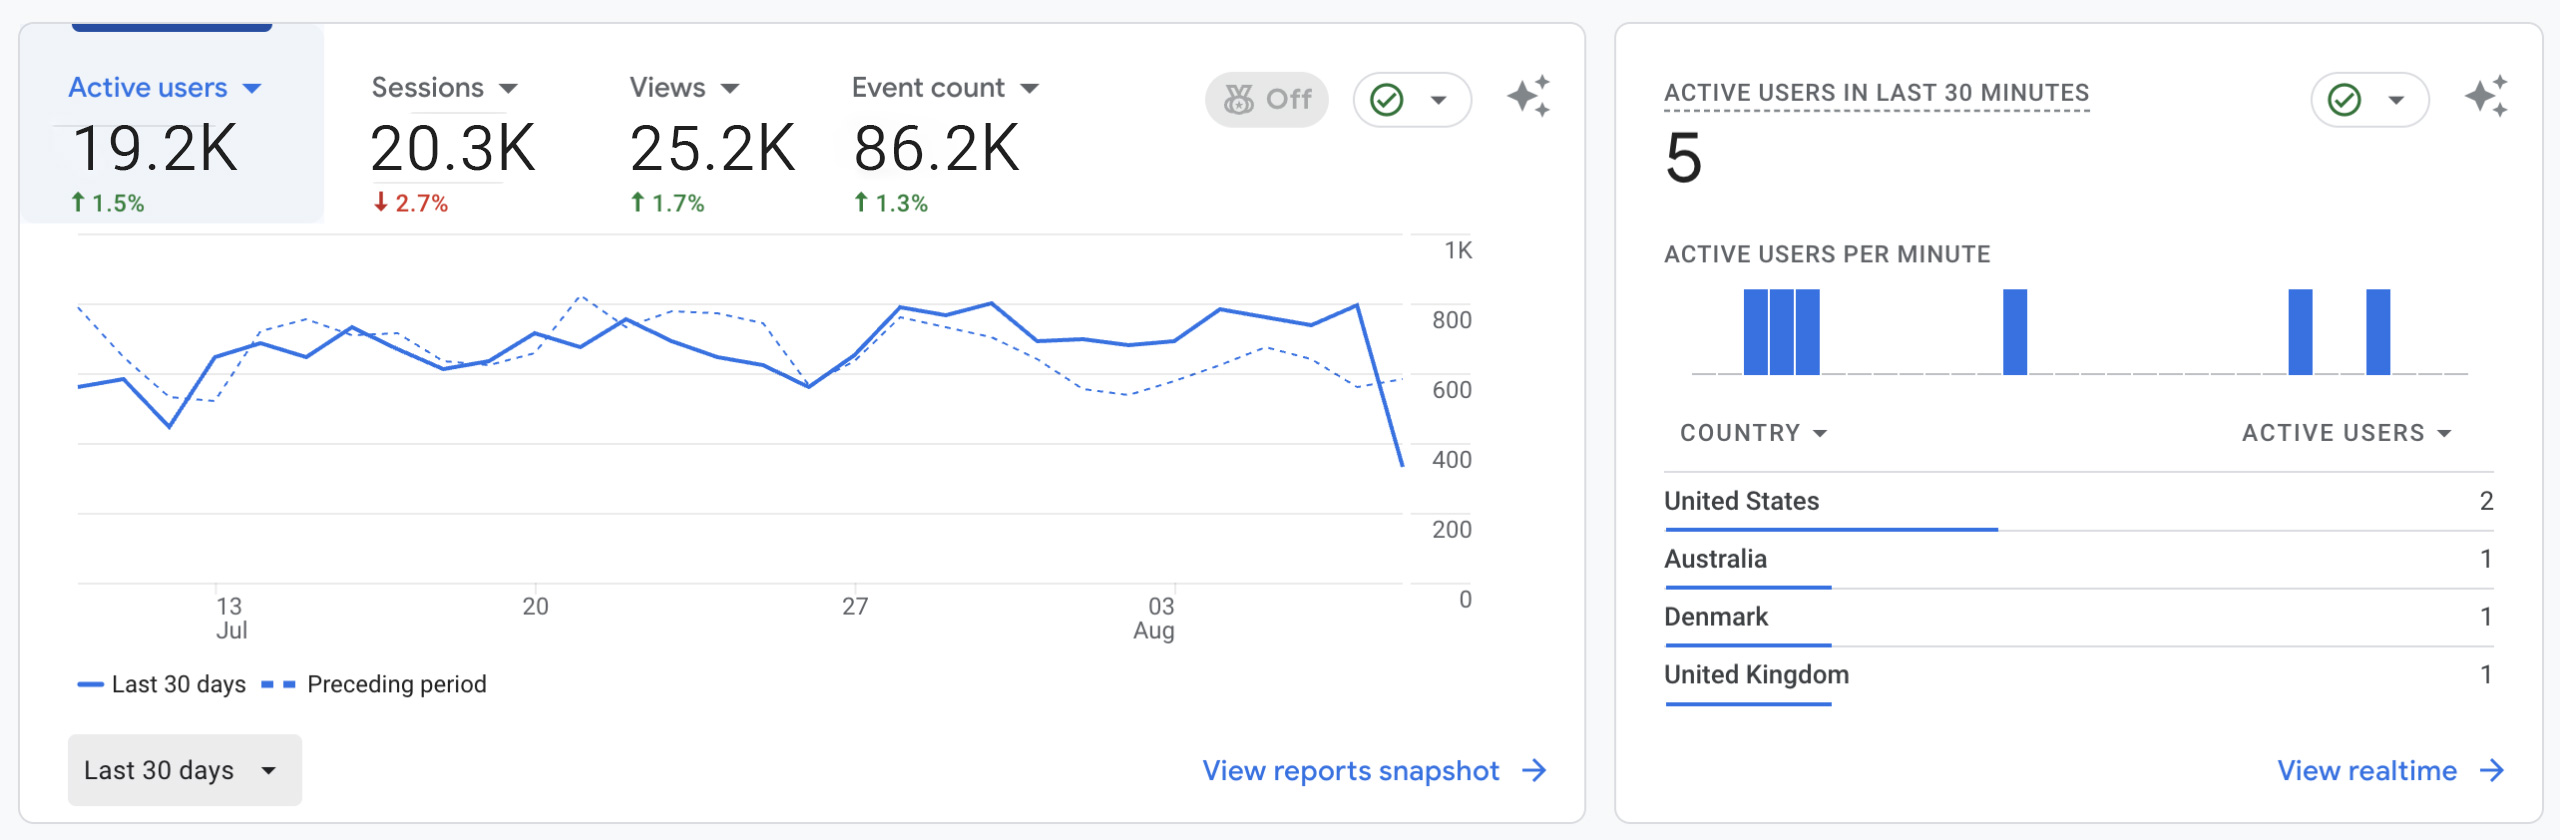
Website Performance Summary — Last 12 Months
Over the last 12 months, Active users increased by 1.5%, reaching 19.2K. Sessions and views also grew, with 20.3K sessions and 25.2K views. The event count was 86.2K, showing slight growth in user engagement. Real-time data shows active users from the United States, Australia, Denmark, and the United Kingdom.